


Visual learners often face challenges when absorbing lengthy articles or complex information. For those who process information better through visuals, tools like NotebookLM can significantly enhance learning and retention. NotebookLM offers features such as Video Overviews, Mind Maps, and Infographics, which cater to the specific needs of visual learners, making information more accessible and engaging.
Maximizing Understanding with Video Overviews
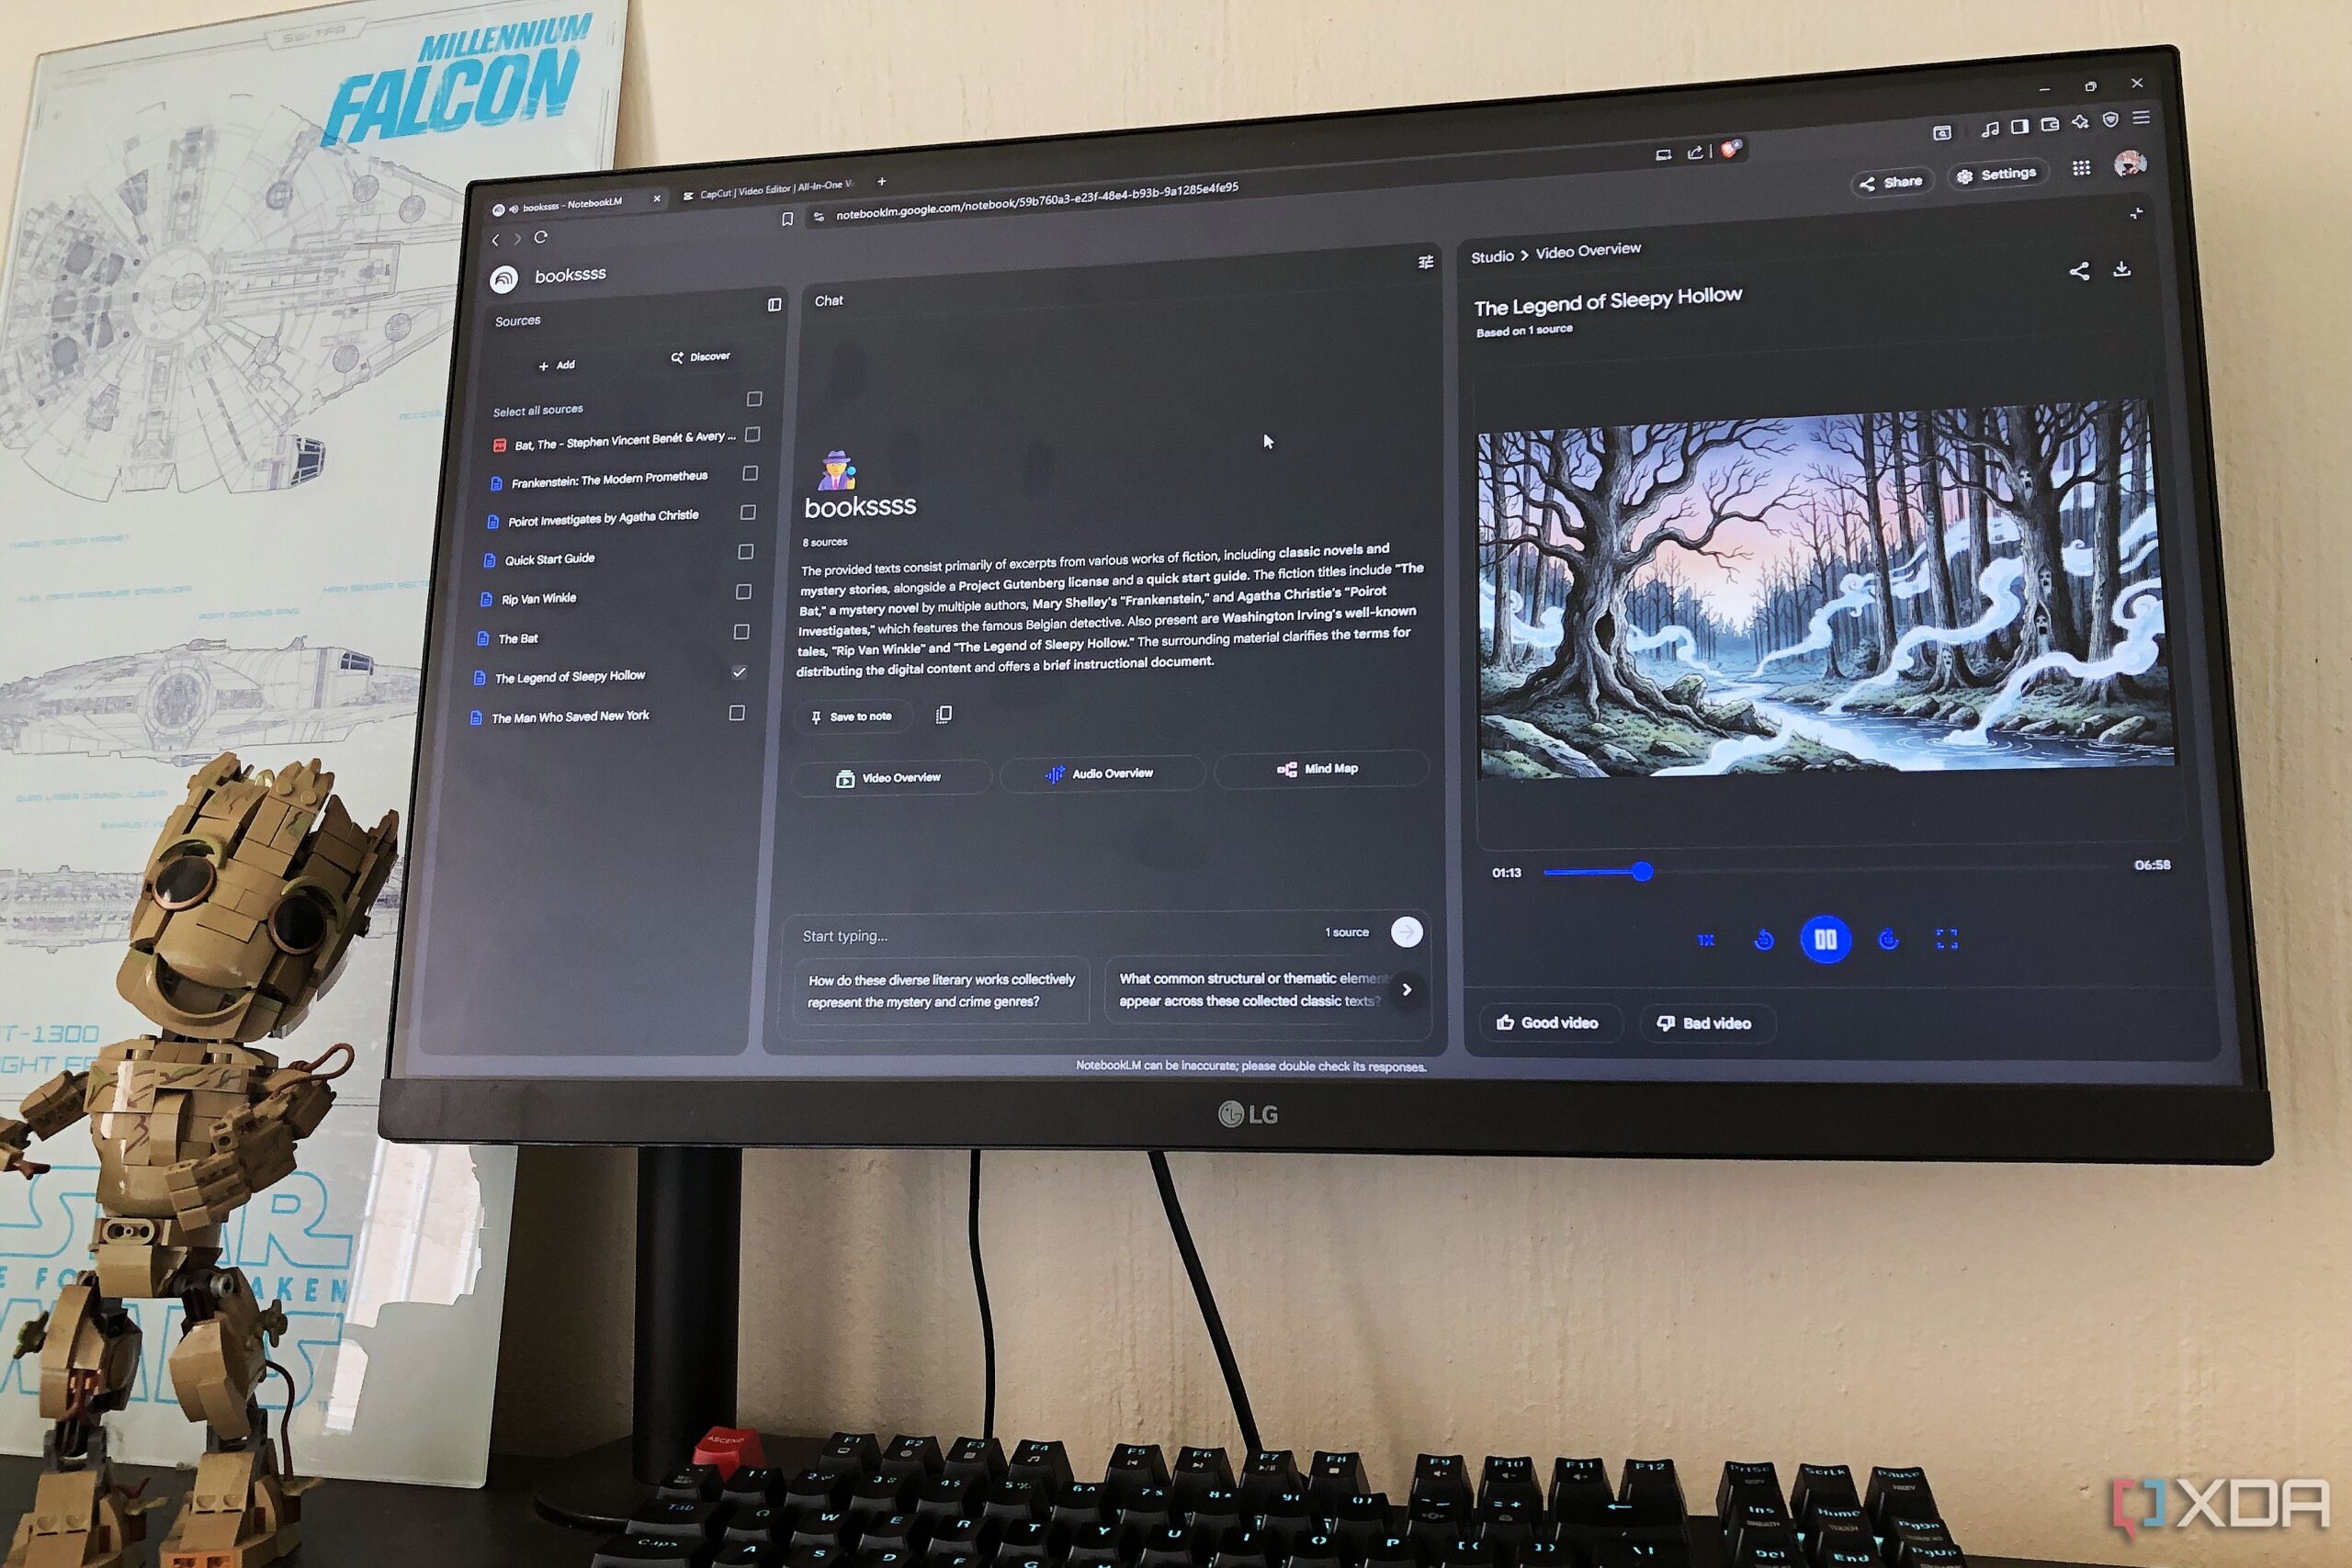
One of the standout features of NotebookLM is its Video Overview functionality. This feature provides a visual and auditory learning experience by combining images related to notes with explanatory audio. Users can view diagrams, quotes, and graphics that break down complex topics into digestible segments. This approach not only aids in understanding but also enhances memory retention.
For instance, when exploring topics like Schedules, users can customize video formats to suit their learning preferences. The Explainer option, for example, produces comprehensive videos that clarify difficult concepts. Features such as the rewind button allow users to revisit specific sections, while adjustable playback speeds facilitate quick reviews. This flexibility makes it easier for visual learners to reinforce their understanding of various subjects.
Organizing Information with Mind Maps
After utilizing the Video Overview, many users turn to the Mind Map feature to gain a broader perspective of the material. Mind Maps offer a visual representation of how different ideas connect, helping learners avoid the pitfalls of re-reading extensive notes. By providing a clear breakdown of main themes and subtopics, this feature enables users to navigate their studies more efficiently.
For example, when working on a notebook about Schedules related to network traffic filtering and access control, users can create a Mind Map that visually outlines the topic. This organization helps learners identify key areas that require further examination, such as Router and IoT Security. Instead of sifting through irrelevant information, users can focus on the most pertinent details, saving time and enhancing productivity.
Creating Infographics for Quick Reference
The final step in NotebookLM’s suite of tools is the Infographic feature, which transforms notes into visually appealing summaries. Infographics are particularly beneficial for visual learners, as they succinctly present important information without the need to read lengthy texts. The organized layout and vibrant colors of infographics make them not only easier to understand but also more enjoyable to review.
For example, a user might create an infographic titled Control Your Connection: How to Schedule Internet Access. This infographic could be divided into two sections: Method 1: Parental Controls and Method 2: Advanced Network-Level Control. By clearly delineating simpler and more complex methods, learners can prioritize their studies and approach each topic systematically. The central clock graphic can serve as a reminder of the fundamental importance of scheduling in managing internet access.
NotebookLM’s features have proven invaluable for users seeking to enhance their learning processes. The combination of Video Overviews, Mind Maps, and Infographics alleviates the struggle of retaining information, allowing learners to focus on what matters most. By incorporating visual aids into their study routines, visual learners can cultivate a more effective and enjoyable learning experience.
As educational tools continue to evolve, NotebookLM stands out as a resource that addresses the unique needs of visual learners. With these features, users can transform how they study and retain information, ultimately leading to greater academic success. For anyone who prefers visual formats over text, exploring these tools could significantly improve their learning outcomes.